Privacy-aware topical explorations (emoji/hashtag) using Sunrise-dataset (Instagram)
This notebook demonstrates:
- visualizations of topical data across spatial dimension
- how to perform intersections of hll sets
- how to union hll sets
The data is providedas CSV files in the privacy-aware hll structure format.
The hll structure is more or less a convention for systematically converting the raw lbsn structure to a privacy-aware format that is based on HLL.
The convention introduces two basic components:
- the overlay and
- the base
The overlay defines what is measured, which can be, for example, number of users (user_hll), number of posts (post_hll), or number of userdays (date_hll). Overlays are stored as HyperLogLog (HLL) sets, which contain statistically approximated versions of original data. It is possible to get an approximation of counts by calculating the cardinality of a HLL Set.
The data in this notebook consists of:
bases
- emoji
- hashtag
- hashtag_latlng
- emoji_latlng
overlay
- postcount
- userdays
- usercount
import os
import geoviews as gv
import holoviews as hv
import pandas as pd
import numpy as np
import warnings
from typing import List
with warnings.catch_warnings():
    # prevent missing glyph warnings
    warnings.simplefilter("ignore")
    import matplotlib.pyplot as plt
from pathlib import Path
from collections import namedtuple
from geoviews import opts
from holoviews import dim
from cartopy import crs as ccrs
from IPython.display import display, Markdown
# init bokeh
from modules import preparations
preparations.init_imports()
pd.set_option('display.max_colwidth', 50)


Load data from CSV
There're 4 CSV files in this directory:
display(pd.DataFrame(Path('.').glob('*.csv')))
Size of a sample csv:
hll_size_mb = Path("sunrise-hashtag-ranking.csv").stat().st_size / (1024*1024)
print(f"Size: {hll_size_mb:.2f} MB")
Preview CSV contents
</br>
</br>
from modules.tools import display_header_stats, print_file_list
display(Markdown("**Data Files:**"))
files = list(Path('.').glob('*.csv'))
print_file_list(files)
display(Markdown("**Content preview:**"))
display_header_stats(files)
HLL unions
Connect to hll worker
To be able to perform hll calculations, we connect to a postgres db with citus hll extension installed:
Define connection parameters:
db_user = "postgres"
db_pass = os.getenv('POSTGRES_PASSWORD')
db_host = "hlldb"
db_port = "5432"
db_name = "hlldb"
connect:
import psycopg2
db_connection = psycopg2.connect(
        host=db_host,
        port=db_port,
        dbname=db_name,
        user=db_user,
        password=db_pass
)
db_connection.set_session(readonly=True)
Store in a method for easier access:
from modules import tools
db_conn = tools.DbConn(db_connection)
Test connection:
db_query = """
    SELECT 1;
"""
db_conn.query(db_query)
Example union
Lets have a look at the first two records in sunrise-hashtag-ranking.csv. We'll only use columns hashtag, postcount and post_hll.
df = pd.read_csv(
    "sunrise-hashtag-ranking.csv", nrows=2, usecols=["hashtag", "postcount", "post_hll"])
display(df)
postcount is the cardinality (the number of distinct elements) of the hll set (post_hll).
This column precalculated while creating the CSV. We can calculate the same number from the hll sets from our CSV:
db_query = f"""
SELECT hll_cardinality(post_hll)::int as postcount
FROM (VALUES
          ('{df["post_hll"][0]}'::hll),
          ('{df["post_hll"][1]}'::hll)
        ) s(post_hll)
"""
db_conn.query(db_query)
Union
Above, the function hll_cardinality(hll) is used to calculate the count of distinct elements. The simple sum of these posts is 4855660+1450241=6305901
Another function is to union hll sets: hll_union_agg()
Below, we union the two sets for posts that used either nature or sunrise.
db_query = f"""
SELECT hll_cardinality(hll_union_agg(s.post_hll))::int
FROM (VALUES
          ('{df["post_hll"][0]}'::hll),
          ('{df["post_hll"][1]}'::hll)
        ) s(post_hll)
"""
df = db_conn.query(db_query)
df.head()
Every post will be counted only once. Since a post can have both the hashtag "nature" and the hashtag "sunrise", the sum is smaller than simply adding numbers. Sunrise and nature were used together in about 1,415,249 posts (22%).
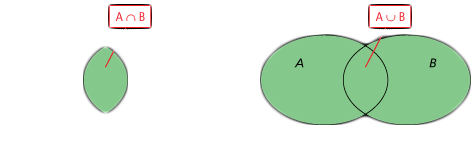
Intersection
This is already a demonstration of intersection, as is emphasized in the citus hll implementation:
Using the inclusion-exclusion principle and the union function, you can also estimate the intersection of sets represented by
hlls.
The following graphic illustrates this ability:
We can make this calculation process a little bit more conventient.
Lets look at another CSV file, instagram-sunrise-dataset_hashtag_latlng.csv, which contains the bases hashtag and lat/lng.
This time, we look at usercount, not postcount.
df = pd.read_csv(
    "instagram-sunrise-dataset_hashtag_latlng.csv", nrows=2, usecols=["hashtag", "latitude", "longitude", "usercount", "user_hll"])
display(df)
Plot points on a map:
points_lonlat = gv.Points(
    df,
    kdims=['longitude', 'latitude'], vdims=['usercount', 'hashtag'])
tools.get_point_map(
    points_lonlat,
    dim_col='usercount',
    title='Estimate User Count per coordinate and hashtag')
The two locations are the highest ranked locations for sunrise in our dataset, based on total usercount.
Intersection question: How many users visited both these locations and referenced the "sunrise"?
db_query = f"""
SELECT hll_cardinality(hll_union_agg(s.post_hll))::int
FROM (VALUES
          ('{df["user_hll"][0]}'::hll),
          ('{df["user_hll"][1]}'::hll)
        ) s(post_hll)
"""
df_1 = db_conn.query(db_query)
df_1.head()
db_query = f"""
SELECT
    hll_cardinality('{df["user_hll"][0]}')::int +
            hll_cardinality('{df["user_hll"][1]}')::int -
            hll_cardinality(hll_union('{df["user_hll"][0]}', '{df["user_hll"][1]}'))::int as IntersectionCount,
    hll_cardinality(hll_union('{df["user_hll"][0]}', '{df["user_hll"][1]}'))::int as unionCount,
    hll_cardinality('{df["user_hll"][0]}')::int as LA_count,
    hll_cardinality('{df["user_hll"][1]}')::int as NY_count
"""
df_2 = db_conn.query(db_query)
df_2["intersection_percentage"] = df_2.intersectioncount / (df_2.unioncount / 100)
display(df_2.head())
display(Markdown((
    f'<div class="alert alert-success"> <b> {df_2["intersection_percentage"][0]:,.2f} % '
    f'of users visited both NY and LA and shared picture with the hashtag sunrise'
    f'</b></div>')))
Since such a low correlation was to be expected, lets have a look at another example intersection. We'll filter the top 100 hashtags, and select only those that appeared at location -8.646196,115.180664 (Bali).
df = pd.read_csv(
    "instagram-sunrise-dataset_hashtag_latlng.csv",
    nrows=20, usecols=["hashtag", "latitude", "longitude", "usercount", "user_hll"])
tools.filter_df_bbox(df, bbox=(114.884171,-8.801279,115.405678,-8.552843))
display(df)
points_lonlat = gv.Points(
    df,
    kdims=['longitude', 'latitude'], vdims=['usercount', 'hashtag'])
tools.get_point_map(
    points_lonlat,
    dim_col='usercount',
    title='Estimate User Count per coordinate and hashtag',
    global_extent=True)
Two different hashtags used at the same location by a number of users. How many users used both of these hastags?
def compile_intersection_union_sql(hll_set_a, hll_set_b, record_a_name: str, record_b_name: str):
    db_query = f"""
    SELECT
        hll_cardinality('{hll_set_a}')::int +
                hll_cardinality('{hll_set_b}')::int -
                hll_cardinality(hll_union('{hll_set_a}', '{hll_set_b}'))::int as IntersectionCount,
        hll_cardinality(hll_union('{hll_set_a}', '{hll_set_b}'))::int as unionCount,
        hll_cardinality('{hll_set_a}')::int as {record_a_name}_count,
        hll_cardinality('{hll_set_b}')::int as {record_b_name}_count
    """
    return db_query
db_query = compile_intersection_union_sql(
    hll_set_a=df["user_hll"][0],
    hll_set_b=df["user_hll"][1],
    record_a_name=df["hashtag"][0],
    record_b_name=df["hashtag"][1])
df_2 = db_conn.query(db_query)
df_2["intersection_percentage"] = df_2.intersectioncount / (df_2.unioncount / 100)
display(df_2.head())
display(Markdown((
    f'<div class="alert alert-success"> <b>{df_2["intersection_percentage"][0]:,.2f} % '
    f'of users used both hashtags, "sunrise" and "bali", at location '
    f'{df["latitude"][0]} {df["longitude"][0]}'
    f'</b></div>')))